Total Pageviews

Wednesday, June 21, 2017

The fast food-obesity myth

The fast food-obesity myth

Fast food is high on the ratings scale to explain the modern epidemic of obesity. It makes sense. These foods are high in calories, high in fat, highly palatable, cheap, available 24-7, heavily marketed to younger persons and totally convenient. Moreover, these compelling attributes of guilt are bolstered by data showing that in the last several decades, the number of fast food outlets has soared, as have the portion sizes of food they serve. Thus it is easy to understand why the term ‘fast food’ rolls so easily off the tongue of policy shapers and makers and why restrictions are called for to limit the number of fast food outlets and to make fast foods unattractive through higher taxation and consumer education. But, as Oliver Cromwell said in addressing the assembled Church of Scotland: “Gentlemen, in the bowels of Christ, I beseech thee. Think it possible you may be mistaken”. So let us turn to several recently published scientific articles on this topic.


The first of these draws on two data sets from the US[1]. The first is county-level data on obesity (BMI>30kg/m2) rates from the Center for Disease Control and the second is county-level data on both fast food restaurants (FFRs) and full service restaurants (FSRs) from the US Department of Agriculture’s economic database. It should be noted that this database lists not only large chain type FFRs and FSRs but also small local such restaurants. In all, data was available for the year 2012 involving 3138 counties across the US involving a population of 170 million. The results were clear cut and expressed thus by the authors: “Our a priori prediction that FFRs and FSRs would be positively linked to obesity prevalence was not supported”. They did find some evidence, which suggested that such establishments were more likely to be located in areas where there was a higher level of both income and education.  The authors then pint out that if that is the case, it would make commercial sense for FFRs and FSRs to be located in more affluent areas and that given the lower level of obesity with higher income and education, these outlets were thus located in lower obesity areas. The authors went on to quantify the extent to which variation in FFRs and FSRs density would explain variation in obesity, and, controlling for all variables (poverty, ethnicity, education, employment, household income, local recreational facilities and health insurance), FFR and FSR density accounted for only 0.8% of obesity.  They also calculated that FFR and FSR together contribute to about a quarter of total US caloric intake.


The second paper is based on data for 25,000+ European adults, 50 years or older drawing on a database from the project: ’Survey of Health, Ageing and Retirement in Europe’ (SHARE)[2]. The countries involved are: Denmark, Sweden, Austria, France, Germany, Switzerland, Belgium, the Netherlands, Spain, Italy and Greece. This survey measured body mass index and household food expenditure, including expenditure on ‘Food Away From Home” (FAFH). The findings are explained thus by the authors: ”Our results suggest, contrary to normative views, that away from home food expenditures negatively affect BMI and that BMI is negatively related to the percentage of the food budget spent away from home”. They go on to conclude: “Given our findings, the implication seems to be that a policy intervention related to the food away from home and obesity issue is not warranted for older Europeans. But if a policy prescription is really needed, then a policy that is directed at promoting better nutritional quality of foods for food-away-from-home might be in order.” The authors note that these data refer only to older Europeans and may not apply to younger citizens. The main findings are summarized in Figure 1 below.


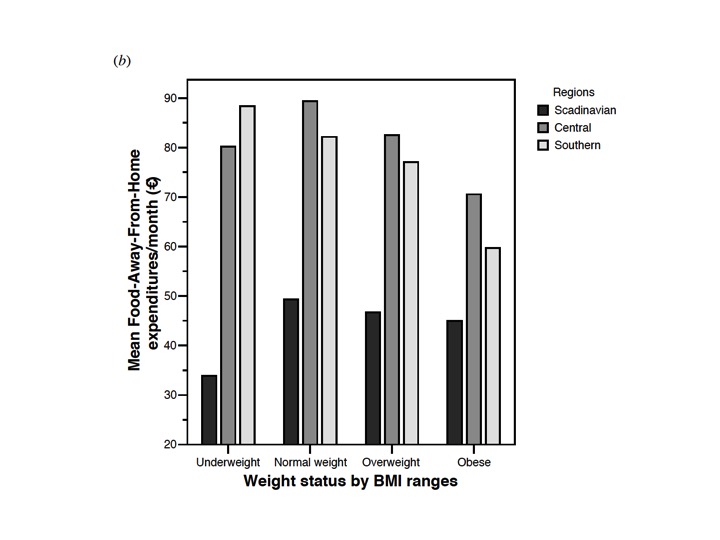
Figure 1 from the second study above on the SHARE database of older Europeans


The third study is US based and draws on The Coronary Artery Risk Development in Young Adults (CARDIA) study which in this case involved 12,174 person-observations who participated in 6 examinations; 1985–2011) across four US cities (Birmingham, AL; Chicago, IL; Minneapolis, MN; Oakland, CA)[3].  The database was used to provide statistical input into a variety of models linking the percentage of neighbourhood food stores or restaurants (per total food outlets within 1 km network distance of respondent residence) with BMI (kg/m2). The models were adjusted for socio-demographic and health behaviour data and for city of residence, timing of subjects examinations, total food outlets and market-level prices. Once again the findings were clear-cut: “Neighbourhood convenience stores and fast-food restaurants were not associated with BMI in any model”.

The fourth and final study brings us away from out of home food purchases to old-fashioned home cooked meals[4]. It recognises that there is ample documentation of the gradual increase in portion size of foods served outside the home. It then asks the question: Has this also happened inside the home. The abstract is short and it is worth presenting it in total: “Since portion sizes have increased outside the home, could caloric content have increased over the years within the home? To examine this, a content analysis of common recipes in Better Homes & Gardens, the bestselling book in its genre, was compared from its first edition in 1930 to its most recent edition in 2010. Recipes were categorized into appetizers, side dishes, entrées, and desserts and analyzed for significant changes in total calories, number of servings, and calories per serving. From its first edition to its most recent edition, the total calories and calories per serving in appetizer recipes significantly increased by 51.18% and 52.5%, respectively. Furthermore, entrée recipes had a significant increase in total calories by 32.96%. As these increases have gone unnoticed for scratch cooks and their families, cookbook users should be wary of these drastic changes and the amount consumed to counteract ever-increasing weight gain”.

All of the above suggests that when there is a knee jerk policy move to curb fast food to reduce obesity, we should absolutely demand evidence. Certainly the first three studies won’t support this knee jerk reaction. The fourth is a bit of a shocker since home cooked food has been the ideal for decades. It is the Walton family shrine of all things wonderful from family home cooked meals to “Goodnight John Boy”. Sometimes such dreams are shattered. So we should focus more on the home and ask ourselves how food portion size in the home (and everywhere else of course) should be reduced. Controlling portion size was recorded by the McKinsey Global Institute as the top priority for policy action in tackling obesity. But rest assured, fast food will always be a handy whipping boy by the evidence-averse mouthpieces of dietary change. Fast food is s corporate villain but what about my local Chinese or Indian takeaway or my local fish and chip shop?


[1] Mazidi m & Speakman JR . Higher densities of fast-food and full-service restaurants are not associated with obesity prevalence. American Journal of Clinical Nutrition. May 2017. 
[2] Body Weight Outcomes and Food Expenditures Among Older Europeans: A simultaneous equation approach Andreas C. Drichoutis1, Panagiotis Lazaridis2 and Rodolfo M. Nayga, Jr. Paper prepared for presentation at the 113th EAAE Seminar “A resilient European food industry and food chain in a challenging world”, Chania, Crete, Greece, date as in: September 3 - 6, 2009
[3]. Rummo PE, Guilkey DK et al. Does unmeasured confounding influence associations between the retail food environment and body mass index over time? The Coronary Artery Risk Development in Young Adults (CARDIA) study. International Journal of Epidemiology, 2017, 1–9 doi: 10.1093/ije/dyx070
[4] Wansink B & Mukund A. Bigger Homes & Recipes: How recipe calories have increased over the years FASEB J April 2017 31:957.8

Wednesday, June 7, 2017

Satiety: Chews your food wisely


Over 100 years ago a health enthusiast named Horace Fletcher warned us that “nature would castigate those that don’t masticate” One hundred ears on and we live in an ‘obesogenic’ food environment characterized by highly palatable, high energy dense foods that are often served in large portions.  These features combine to promote energy intake, and when the foods are softly textured, they can increase the rate of eating (g/min) and promote energy intakes even further.  The current global rates of obesity would be enough to make Fletcher grind his teeth in disappointment!

We are told that hyper-palatable, energy dense foods rich in sugar and fat and are ‘engineered’ to be less satiating and to encourage consumption.  These commonly come in packaged processed foods but also in the home food environment where energy dense Dauphinoise potatoes, tagliatelle carbonara and cheesecake can also promote passive overconsumption. Very high levels of fat and sugar are absolute characteristics of dessert dishes such as franigpan or baklava and are more often home made than purchased as a prepared dish.  However we may well ask, is it possible to also apply the same rationale to reversing this trend and use the sensory properties of foods to promote eating behaviour’s that drive satisfaction while supporting energy intake reductions? 

This is the approach being applied by a group of researchers led by Professor Ciaran Forde at the Clinical Nutrition research Centre of the National University of Singapore in one of their recent scientific publications[1].

The authors begin with an elaboration of the research that they and others have done, which show definitively, that the rate at which we eat a food (eating rate: ER) greatly influences overall meal intake.  The basic unit in this regard is grams of food per minute and is strongly influenced by bite size and the total number of bites taken within a meal.  That determines what goes into the mouth. Thereafter, the key measures are chews per bite and time in mouth with the longer the chewing the more satiating the food per kcal consumed (remember what Fletcher said about ‘castigate’ and ‘masticate’).  In effect this is about bites, chews and swallows.  All can be quantified using simple behavioural coding of video recordings of people as they eat.  All available evidence shows that the larger the portion size, the greater energy density, and the faster one eats, the more energy is consumed within a meal. The key question posed by the team in Singapore is whether we could use food texture to better regulate food intake within a meal and could this offer some protection against larger portions and higher energy density?  They opted to conduct their experiments with a traditional rice-based breakfast widely consumed in Singapore among a group of healthy regular breakfast consumers.  The key part of the study was to modify the texture of the breakfast to effect a change in eating rate, and this was achieved by greater or lesser milling of white and brown rice grains.  The energy density served was low (0.5kcal/g) or high (1.0kcal/g) and was changed by varying the amount of both sunflower oil and the starch product, maltodextrin.  In the study, the portion sizes offered were either 700 grams or 1050 grams. Thus the effect of thickness was examined for a given portion size when energy density varied and in the second study, the effect of thickness was studied when energy density was held constant but with portion size varied. The key points of the results are as follows:

Þ   Constant portion size: Increasing the thickness of the breakfast led to a higher bite size (about 30% higher), higher oral exposure per bite (about twice as high) and more chews per bite (about three times higher). This was not influenced by the energy density of the diet. The overall eating rate was halved by the thicker porridge leading to a decline in caloric intake at breakfast of about 75 calories
Þ   Constant energy density: Higher portion sizes led to an increase in breakfast intake compared to smaller portion size (487 v. 425 g). Thicker porridges led to lower intakes than thinner porridges (425 v. 488g). The thicker porridge almost halved the eating rate.

The bottom line is that by manipulating texture, significant beneficial effects in caloric intake from the test breakfast were seen.  Thus the options for the reformulation to consider extend beyond portion size and energy density to also use food texture in a way that effectively changes eating behaviour.  In each case there were no differences in post-meal hunger or fullness and the changes did not reduce palatability, if anything in the thicker breakfast liking tended to go up.  These results are encouraging at a time when food processing is under attack and the results suggest that processing techniques like thickening, hardening, extruding and adding ‘crunch’ can be used to change our eating behaviours and effect a change in energy intake without a loss in eating pleasure or satisfaction.

Food technology can help alter the characteristics of foods such as texture and energy density to extend eating time and thus to reduce energy intake.  Here is where the rubber hits the road.  How do everyday food choices and eating behaviours, which are often habitual and routine link up with our internal biologic control of food intake? With the huge failure rates of dieting with a 2-year relapse rate of about 50% and a 5-year relapse rate of about 95% we can ask – is it possible to restrict intake long term to prevent weight re-gain? The study described above could help to mitigate the need to feel restricted or deprived, by re-engineering the food environment to extend the eating time for meals and support energy reductions. 

We are largely unaware of the precise energy content of the foods we eat, and the largest variations in energy intake tends to occur within meals in calories consumed to the onset of fullness (satiation).  The present study is one of a new breed of controlled feeding trials that highlight how a food’s sensory properties can be used to promote fullness and show that the act of consuming a satisfying meal is itself a strong satiation cue. Here we see the application of sensory properties like meal texture to not only promote palatability and liking, but also to act as functional cues to promote satiation and satiety. All this is now possible in the modern processed food world, far removed from the original ideas proposed by Horace Fletcher. Today, modern food processing techniques contribute food safety, and reformulation and food processing techniques can be applied to change energy density, and enhance the eating experience through food texture. 

My thanks to Prof Ciaran Forde for fact-checking and editorial input.


[1] Keri McCrickerd et al (2017) Texture based differences in eating rate reduce the impact of increased energy density and large portions on meal size in adults. Journal of Nutrition, March 27th.

Tuesday, March 14, 2017

The Paradox of Oz: Sugars down, obesity up

A casual glance at either the print or social media would lead one to conclude with absolute certainty that the world is eating more and more sugar and consequently is getting fatter and fatter. No one could dispute the latter with very clear objective data to show that global obesity rates are experiencing a relentless rise. The former part of this apparent ‘fact’ is very much out of kilter with the objective data. In a review of the changes in the percentage calories from sugar over recent times based on national dietary surveys, it is clear that there is no relentless rise in sugar intake globally and, if anything, there are clear signs of a drop in sugar intake over recent times. The following data has been extracted from a major review of global patterns of sugar intake based on national diet surveys[1]:

Country
Survey 1
Survey
2
Sugar calories
 (%)
 in survey 1
Sugar calories
(%) in survey 2
Sugars defined
as:
Australia
1983
2011/12
17.0
18.6
All
Austria
1998
2012
9.0
9.0
Sucrose
Denmark
1995
2003/6
9.0
9.0
Added
Finland
1992
2012
9.0
9.2
Sucrose
France
1993/4
2006/7
12.0
14.4
Sugars
New Zealand
1989
2008/9
6.6
8.2
Sucrose
Norway
1997
2010/11
9.5
7.2
Added
Sweden
1989
2010/11
7.7
9.4
Sucrose
Netherlands
1987/8
2007/10
23.6
18.0
All
UK
2000/1
2011/12
13.5
11.6
Added


From the above data, it is clear that over the last 30 or more years, the intake of sugars, however defined, has not shown any concerted global tend to increase. The above data are for males and the female data is pretty similar. Some countries have data on both sexes combined and again they show no upward trend: Ireland constant at 16.6% of calories from non-milk sugars over the period 1997-2006 and the USA with values of 13.9 and 11.8% of calories from added sugars over the period 1971/75 to 2007/8.

The most exact analysis of trends in sugar intake comes from my alma mater at Sydney University led by Professor Jenny Brand-Miller[2]. These authors looked at four independent data sets to examine the changing patterns of sugar intake in Australia. The authors point out that obesity continues to rise in the Land of Oz: obesity rates have quadrupled from childhood into adulthood for both males and females with Australia and New Zealand exhibiting the largest single absolute rise in obesity since 1980 in a global comparison such data[3]. So what of their sugar intake?

The Food & Agricultural Organisation (FAO) of the UN measures the “disappearance” of sugar in countries worldwide which takes overall national production data, adds imports and subtracts both exports and non-human use. If used wisely and for time trends only, such data can be very valuable. In Australia, such data shows a decline in per capita intake of sugar from 152 grams per day in 1980 to 127 in 2011. Using similar techniques, data from the Australian Bureau of Statistics shows a 17% reduction in apparent sugar consumption from 1961 to 2011 (139 to 115g/hd/d). Data from Australian National Nutrition Surveys, which are based on surveys of actual sugar intake at individual level, also show a decline in total sugar intake, from 115 grams per day in 1995 to 105 in 2012. Given that among the devils of sugar sources, those from beverages are considered as the Satanic level, it is interesting to note that such Satanic influences have also fallen over time. No matter how defined (soft drinks, sugar sweetened beverages, sugary products, sodas plus juices etc.), the time-related decline of sugar intake in liquid form is still obvious. Data from industry sources were also made available to the authors and once again, no matter how defined, the same pattern of a decline in solid and liquid sugar intake is seen.  For example, the % of children classified as “consumers “ of sugar-sweetened beverages declined from about 65% in 1995 to 25% in 2012. Energy from sugar-sweetened beverages plus juices in children fell from an average of 9.2 % of calories in 1995 to about 5.5% in 2012. All in all, there is not a shred of evidence from the either global overview or the Australian deep-dive into sugar intakes to suggest any rise whatsoever in sugar intakes.

Why therefore do we suffer the avalanche of data telling us about the poisonous nature of sugar and the wicked damage it is doing to the health of our children? In my view this is a consequence of our post truth era where post-truth is defined by The Oxford Dictionary as: ‘An adjective relating to or denoting circumstances in which objective facts are less influential in shaping public opinion than appeals to emotion and personal belief’. You see, sugar was extracted on the back of the global slave trade and is now used by corporate food giants to manipulate the food supply to make a tasteless mechanically derived ultra-processed foods into ones which are rendered hyper-palatable with copious levels of added sugars. Gurus from California with impeccable medical backgrounds have shown conclusively that sugar is toxic, the new tobacco in fact. Tax the damn thing and be done with it! That’s the emotional argument. It wins out every time against the peer-reviewed data cited in this blog. As a life timer in nutrition I have come to accept this and other such misuse of nutritional data and its adaptation by populist experts and governmental departments. But at least I can rant on my blog. It’s cheaper than therapy!!!


[1] Wittekind A & Walton J (2014) Worldwide trends in dietary sugars intake. Nutrition Research Reviews, 27, 330-345
[2] Brand-Miller JC & Barclay A (2017).  Declining consumption of added sugars and sugar sweetened beverages in Australia: a challenge for obesity prevention. American Journal of Clinical Nutrition, March 8th, doi: 10.3945/ajcn.116.145318
[3] . Ng M, Fleming T, Robinson M, Thomson B, Graetz N, Margono C, Mullany EC, Biryukov S, Abbafati C, Abera SF, et al. Global, regional, and national prevalence of overweight and obesity in children and adults during 1980-2013: a systematic analysis for the Global Burden of Disease Study 2013. Lancet 2014;384:766–81.